My Old Laptop Felt Sluggish. Its GPU Was Stuck in Slow Mode.
October 10, 2026

I’ve been using my old Lenovo Y500 again. It’s a 2013 laptop with an NVIDIA GeForce GT 750M, now running Ubuntu, and it does its job. But it felt a bit sluggish, so one evening I went looking for the reason. First question: is the GPU even working properly?
It was working. It just wasn’t working very hard. The graphics card was running at its slowest possible speed, all the time, with its memory at one-sixth of what it’s rated for.
NVIDIA stopped supporting this generation of cards years ago, so Linux uses the open-source driver, called nouveau. It’s good, but it starts the card at its lowest clock level and never raises it.
Then the developer in me spoke up. I had Claude Opus 5.5 running right there on that laptop, able to read logs and run commands. So why not tinker with it properly, and test as we go?
Three levels, one step at a time
The driver lists three clock levels for this card:
| Level | Core | Memory |
|---|---|---|
07 (what it boots with) |
405 MHz | 810 MHz |
0a |
up to 1058 MHz | 1600 MHz |
0f |
up to 1058 MHz | 5000 MHz |
The obvious move is to jump straight to the top. The smart one is to go up one level at a time, because on some laptops of this era a higher level can freeze the whole screen.
So before changing anything, we put the guards in place:
- An automatic revert. Every test armed a timer that put the card back on its slowest level after 5 minutes. It ran as a system service, outside the terminal, so it would still fire even if the desktop locked up.
- A temperature cut-off. If the GPU reached 85°C during a test, it dropped back straight away instead of waiting out the timer.
- A reboot as the last resort. The card always starts on the slow level, so the worst case was a frozen screen and a restart, never a broken laptop.
With that in place, the first test was the middle level, 0a. It ran for five minutes while I kept using the laptop: stable, never above 55°C, and about 60% faster in a quick 3D benchmark. Then the timer switched it back, exactly as planned.
Two tracks
While the clock tests ran, we started a second track. Kepler cards like this one have a dedicated chip for decoding video. If it worked, the CPU wouldn’t have to do that job.
That track ended in a dead end. The video chip needs a small piece of firmware, which loaded fine, but every attempt to decode a video crashed the player. Reading the kernel logs led us to an open Mesa bug, reported on this exact GPU, plus a second one in the kernel driver. Neither has a fix yet. So we removed the firmware, and video stays on the CPU, which handles 1080p without dropping a frame anyway.
Knowing why something doesn’t work, with a bug link to watch, is a perfectly good outcome for an evening.
Back to the clock speed, with something to watch
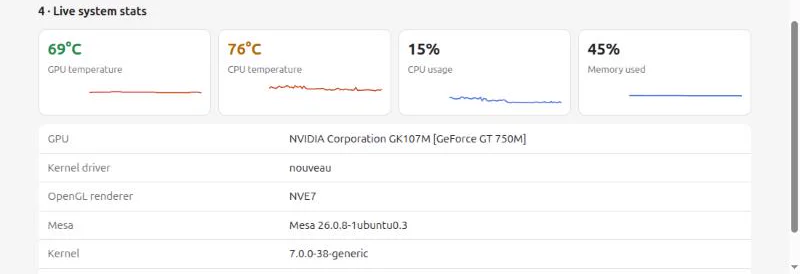
For the top level, I wanted to see what was happening rather than read numbers in a terminal. So we built a small page, the GPU Test Bench. It plays a 1080p test video and counts dropped frames, runs a 3D load test with an FPS counter, and, when run on the laptop itself, shows live graphs of GPU and CPU temperature.
Try it right here, on whatever you’re reading this on. It runs entirely in your browser, nothing to install, and nothing starts until you press the button:
Then the real test: level 0f, with memory at 5000 MHz, for five minutes with the 3D load running the whole time. It held steady and peaked at 69°C, well under the cut-off.
| Level | 5-minute test | Peak temperature | GPU Test Bench score |
|---|---|---|---|
07 (boot) |
— | 57°C idle | ~50 |
0a |
✅ stable | 55°C | — |
0f |
✅ stable, under constant 3D load | 69°C | ~110 |
Same laptop, same test, more than twice the score. Run the test above and see where your device lands.
Making it stick, safely
One last surprise: the driver knows the GPU’s temperature limits, but it never slows the card down when it gets hot. Between roughly 85°C and an emergency shutdown at 135°C, nothing happens.
So the guard from the tests became permanent. A small service now starts at boot and puts the card on 0f. It checks the temperature every five seconds, steps down at 85°C, drops to the slowest level at 92°C, and climbs back up once things cool below 70°C. Every change is written to the system log, so I can always see what it did and why.
On a normal day it does nothing at all. That’s the point.
What I liked about this
None of it was clever. The whole evening was small steps, each with a way back: test one level, watch it, let it revert, then decide on the next one. It’s the same way you’d roll out a risky change at work, applied to a 13-year-old laptop.
Having an AI pair that could read kernel logs, dig through bug trackers and write the safety nets before we touched anything made that easy to stick to.
Try it yourself
- Open the full GPU Test Bench for the live 3D view and everything your browser knows about your GPU. Works on phones too.
- Download it (2.6 MB) to get the live temperature graphs on your own machine: unzip, run
python3 serve.py, and openhttp://127.0.0.1:8767. It needs only Python 3 and never leaves your computer. - Got a Kepler-era NVIDIA card (GeForce 600 or 700 series) on nouveau? The temperature guard script and its service file are there too. Read them first, and test your own levels with a revert in place before making anything permanent.